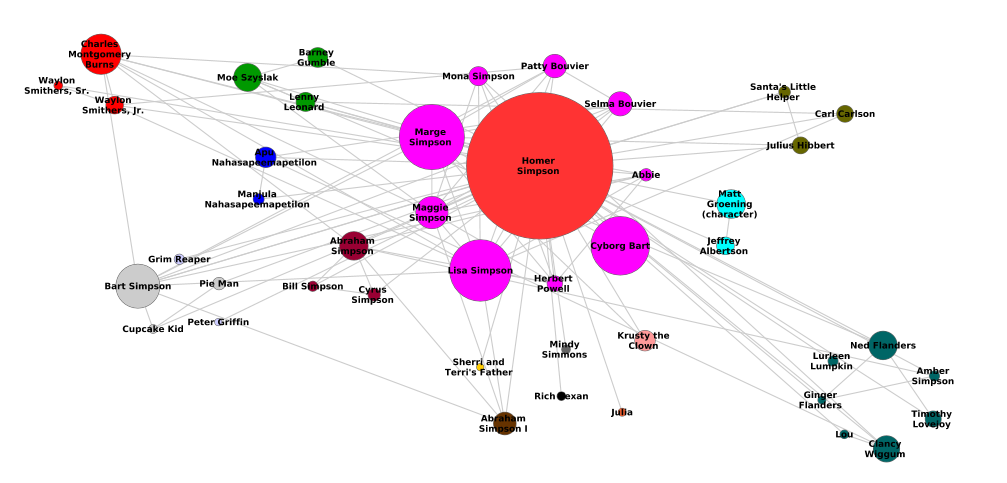
The Simpsons network
The graph below shows the network of all the characters of The Simpsons, main and guess characters, and the connections between them. This visualization allows us to have a nice overview of how the characters are connected to each other. We can see the main Simpson family members: Homer, Marge, Bart, Lisa and Maggie, have the biggest nodes wich means they are connected to most of the characters of the serie, as they are the main characters!
Other characters are also important and worth be mentioned as they play big roles and make the serie so special. They are for example the closest Simpon family members as Grampa, Patty and Selma, the Bart and Lisa school mates as Nelson and Milhouse and the principal Skinner, the Nucleat Plant crew and, of course, the kind and religious neighbor Ned Flanders.
Your turn!
Check how much do you know about the relations in The Simpsons interacting with the graph.
The graph allows you add and substract nodes as well as zoom in and zoom out to see with more detail the network. You can also move the nodes and see all the connections of that node.
Homer ego-network
The graph bellow shows the Homer Simpson ego-network and the communities in it. There are 16 communities formed with the characters that have a connection between each other. The communities are shown in groups with different colors to make it easy to view and the nodes have different size depending the number of connections it has.
We can see in the graph some of the well-known communities as the following ones:
We can see in the graph some of the well-known communities as the following ones:
- The Simpson family: Lisa, Marge, Maggie, Patty and Selma, Mona (Homer's mom), Herbert Powell (Homer's older half-brother).
- Homer friends: Moe, Barney, Lenny.
- Nuclear Plant: Mr. Burns, Smithers Sr. and Smithers Jr.
- Neighbours and other close friends: Flanders, Chief Wiggum and the policeman Lou and the Reverend Lovejoy.
- Others: the marriage Apu y Manjula Nahasapeemapetilon.
Eigenvector centrality
Eigenvector centrality is a measure of how much a given node can influence the rest of the network. A high Eigenvector centrality implies that the node have connections to many nodes with many connections.
The nodes (characters) are coloured depending on the value. Red means high and white means low.
Top 5 characters:
The nodes (characters) are coloured depending on the value. Red means high and white means low.
Top 5 characters:
- Homer Simpson 0.377419
- Lisa Simpson 0.354119
- Maggie Simpson 0.268437
- Marge Simpson 0.268221
- Bart Simpson 0.253396
Degree centrality
Degree centrality is a measure of how central a node is. The more connections a node has, the higher the degree centrality is.
You can see the degree centrality in the graph of The Simpsons network above. The highest a node is, the highest degree it has.
Top 5 characters:
You can see the degree centrality in the graph of The Simpsons network above. The highest a node is, the highest degree it has.
Top 5 characters:
- Homer Simpson 0.115282
- Lisa Simpson 0.088472
- Bart Simpson 0.067024
- Charles Montgomery Burns 0.058981
- Maggie Simpson 0.053619
Betweenness centrality
Betweenness centrality is a measure of how central a node is. The betweenness centrality is calculated by finding all the shortest routes (the route with the shortes distance between two nodes), and then count the number of routes through each node. A node with a high betweenness centrality is thus a good bridge between other parts of the network.
The nodes (characters) are coloured depending on the value. Red means high and white means low.
Top 5 characters:
The nodes (characters) are coloured depending on the value. Red means high and white means low.
Top 5 characters:
- Homer Simpson 0.398557
- Lisa Simpson 0.184157
- Bart Simpson 0.149705
- Seymour Skinner 0.137478
- Charles Montgomery Burns 0.136727
Closeness centrality
Closeness centrality is a measure of how central a node is. A node with a high closeness centrality means that the distance (number of steps) from the node to any other nodes in the network is low.
The nodes (characters) are coloured depending on the value. Red means high and white means low.
Top 5 characters:
The nodes (characters) are coloured depending on the value. Red means high and white means low.
Top 5 characters:
- Homer Simpson 0.381001
- Lisa Simpson 0.354563
- Bart Simpson 0.346332
- Marge Simpson 0.336947
- Maggie Simpson 0.333930
